
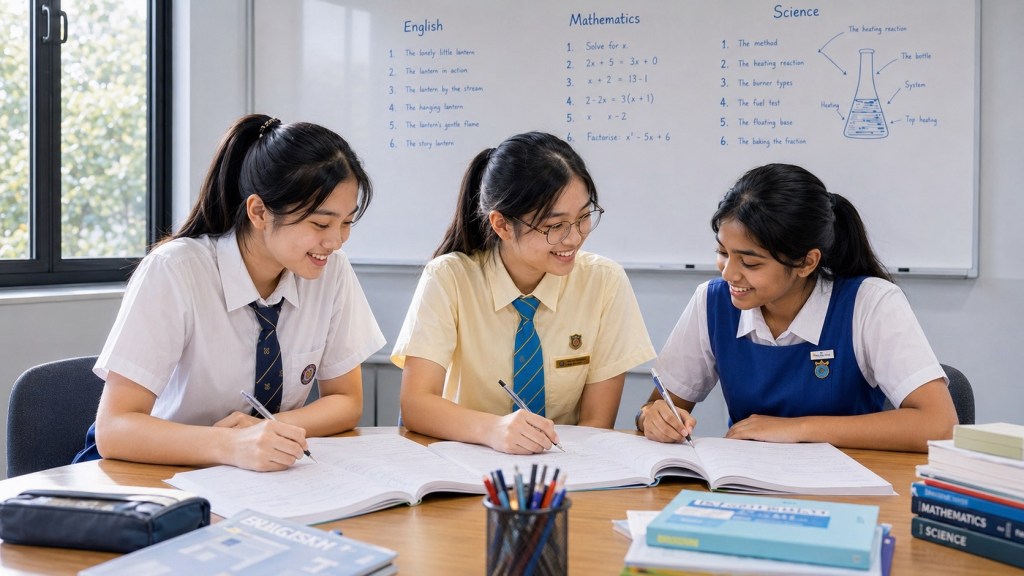
Secondary Science becomes faster to learn when students stop treating every chapter as a separate pile of facts and start mastering four transferable jobs: models, data, practical work and explanations. Parents searching for SEC G1 Science, G2 Science, G3 Science, Secondary Science tuition, a Science tutor in Sengkang or Science help near Punggol are often responding to the same transition: the student may have survived Primary Science by recognising familiar question patterns, but Secondary Science increasingly asks the learner to work with abstractions, subject-specific representations, quantitative relationships and more formal experimental reasoning.
This guide is deliberately different from a general “PSLE to Secondary Science” transition page. It is a tutorial operating system for the skills that travel across Physics, Chemistry and Biology. For Sengkang and Punggol families, it provides a way to diagnose why a Secondary Science student is stuck without assuming the problem is simply “too much content”. A learner may know the facts but misuse a model, read a graph inaccurately, design a weak investigation or write an explanation that skips the mechanism.
Singapore’s Secondary Education Certificate begins from 2027, and SEAB publishes subject syllabuses under G1, G2 and G3 levels. Students and parents should always check the current official syllabus for the exact subject combination, content and assessment requirements. The SEAB SEC syllabus page is the authoritative starting point. This article does not assume that G1, G2 and G3 are identical; instead, it identifies a common learning architecture that can be adjusted to the depth, pace and assessment demands of the student’s actual syllabus.
Quick answer: the four-skill SEC Science tutorial
- Models: understand what a scientific model represents, what each part means, what relationships it makes visible and where its limits are.
- Data: read tables, graphs, scales, units and patterns before trying to explain them.
- Practical work: connect questions, variables, measurements, methods, evidence, limitations and conclusions.
- Explanations: use evidence and scientific ideas to build a mechanism from condition to outcome.
A strong tutorial should move among all four. A student may begin with a particle model, use it to predict a pattern, inspect data from an experiment, then explain the pattern using the model. That integration is closer to how Secondary Science actually works than studying “definitions”, “graphs” and “experiments” as unrelated skills.
Why Secondary Science can suddenly feel difficult
The jump is not only an increase in content. Secondary Science asks students to reason with things they cannot always see directly. Particles, forces, energy transfers, electric current, cells, chemical species and rates are represented through diagrams, equations, graphs and conceptual models. The student must learn what those representations mean and how to move between them.
Questions also become more quantitative. Even when the mathematics is not advanced, Science uses ratios, gradients, rates, proportional relationships, unit conversions and multi-step calculations. A learner can understand the Science idea but still fail because the numerical representation is unstable. Conversely, a learner can calculate correctly while misunderstanding what the number means scientifically.
The fastest tutorial therefore asks, “Which representation is breaking?” rather than simply assigning more chapter questions.
Skill 1: models — the language of invisible Science
A scientific model is a purposeful representation. It helps students reason about a system that may be too small, too large, too fast, too slow or too complex to inspect directly. The danger is that students can memorise the picture while missing the idea the picture represents.
Every time a model appears, ask five questions: What system is this representing? What does each symbol or part stand for? What relationship is being shown? What prediction can the model help us make? What does the model leave out? The final question matters because models simplify. A particle diagram is not a literal photograph of particles, and a circuit symbol is not a miniature drawing of the physical component.
From picture recognition to model reasoning
A weak model learner says, “I remember this diagram.” A stronger learner can reconstruct the diagram, label what each part means, change one condition and predict how the representation should change. The tutorial should deliberately vary the surface form so the student learns the relationship rather than the artwork.
For example, if a student is working with a particle model, do not only ask for the standard arrangement. Ask what changes when state, temperature or another relevant condition changes within the syllabus. Ask which features of the representation are meaningful and which are merely drawing choices. Then ask the student to use the model to explain an observation.
Model translation
Strong Secondary Science students translate among representations. A paragraph can become a diagram; a diagram can become a verbal mechanism; a graph can be connected to a model; a symbolic relationship can be explained in words. Translation is a powerful diagnostic because a memorised representation often collapses when the student must express the same Science another way.
A tutor can use a three-step routine: read the model, explain the model, use the model. First identify the parts and relationships. Second explain what scientific idea is encoded. Third use it to predict, compare or justify something new. If the student succeeds only at step one, more copying is unlikely to solve the problem.
Common model errors
- Treating a model as a literal picture rather than a representation.
- Memorising labels without understanding relationships.
- Using a model outside the conditions where it is useful.
- Failing to connect a diagram to evidence or observations.
- Changing a drawing without knowing which features are scientifically meaningful.
- Knowing the model but being unable to explain it in words.
Each error needs a different repair. “Revise the diagram again” is too vague.
Models in Physics: force, energy, motion and circuits
Physics often compresses a situation into a model: a free-body representation, an energy-transfer account, a circuit diagram, a ray diagram, a graph of motion or a mathematical relationship. Students need to know which details matter for the question.
Take forces. A student may memorise names such as weight, normal force, friction and tension, yet still struggle to decide which forces act in a new situation. The tutorial should begin with the system: which object are we analysing? What is interacting with it? In which directions do those interactions act? Only then should labels be attached.
For energy, avoid treating every question as a keyword hunt. Ask where energy is stored or transferred according to the syllabus, what process causes the transfer and what observable change results. The student should be able to connect the model to evidence rather than recite a memorised chain detached from the scenario.
For circuits, trace relationships through the circuit rather than relying on visual resemblance. A circuit can be redrawn without changing its electrical connections. Students who recognise only the familiar layout are vulnerable when components are repositioned. Ask the learner to follow connections, identify branches and explain what a change in arrangement means for the relevant quantities at the appropriate level.
Models in Chemistry: particles, substances and change
Chemistry asks students to connect three worlds: what can be observed, what is represented at the particle or microscopic level, and what is written symbolically. Learning becomes fragile when these remain separate.
A tutorial should repeatedly move among them. Start with an observation or described change. Ask what particle-level model could account for it. Then connect that model to the relevant chemical notation if it is part of the syllabus. The exact symbolic demands vary by course level, so the current G1, G2 or G3 syllabus should control the depth.
One useful diagnostic is to ask what stays the same and what changes. Students can confuse rearrangement with disappearance, concentration with amount, or visible change with chemical explanation. A clear model helps them track entities and relationships instead of relying on surface appearance.
Models in Biology: structures, systems and processes
Biology can feel descriptive because there are many terms, but strong learning depends on systems thinking. A structure has a function; a function supports a process; processes interact within a system; changing one condition may affect several linked outcomes.
Teach biological diagrams as functional maps rather than label sheets. For each structure, ask: what does it do, how does its form support that role, what enters or leaves, what process depends on it and what evidence would reveal a change? This turns vocabulary into a network.
When students meet cycles or pathways, ask them to reconstruct the sequence without the picture, then redraw it from memory and explain each connection. If they can name every box but cannot explain the arrows, the model is not yet doing useful scientific work.
Skill 2: data — read before you explain
Data questions punish premature explanation. Students often see a graph, recognise the chapter and immediately write the expected theory. A better routine delays explanation until the representation has been read accurately.
Use the sequence ORIENT → READ → COMPARE → CALCULATE → DESCRIBE → EXPLAIN. Orient means identify what the table or graph is about. Read means inspect axes, headings, units and scale. Compare means identify relevant differences or similarities. Calculate only if the relationship requires it. Describe the pattern without adding causes. Explain only after the evidence is clear.
Axes and units
A surprising number of errors begin before the Science reasoning starts. The student reads the wrong axis, ignores a multiplier, misses a unit or assumes the scale begins at zero. Train a two-second axis check until it becomes automatic. In tables, read the column heading and unit together.
Change versus final value
Students can compare final values when the question asks for change. Suppose two samples begin at different temperatures. The sample with the higher final temperature did not necessarily undergo the greater temperature change. Write the starting and final values, then decide what quantity the question actually asks for.
Trend versus isolated point
A trend is a relationship across several observations, not one convenient data point. Ask the student to describe the overall pattern and then note meaningful exceptions or plateaus. If the data do not support a simple relationship, the answer should not invent one.
Correlation and explanation
When two quantities change together, the graph shows a relationship in the data. Explaining why requires scientific knowledge and the conditions of the investigation. Students should learn to separate “what the graph shows” from “why the pattern may occur”.
A worked data tutorial
Imagine a graph showing the temperature of two liquids over time. Before discussing heat transfer, ask the student to identify the starting temperature of each, the time interval, the direction of change and which liquid shows the greater change over the specified period. Then ask for a scientific explanation consistent with the setup. This ordering reveals whether the error belongs to graph reading or Science reasoning.
After correction, change the graph. Reverse the starting values, alter the time interval or present the same data in a table. If the student can still select the correct comparison, the skill is becoming transferable.
Mathematics inside Secondary Science
Science calculations are not an unrelated Mathematics paper. The calculation represents a physical, chemical or biological relationship. Students need both procedural accuracy and scientific interpretation.
A useful routine is quantity → relationship → substitution → unit → meaning. First identify what quantity is required. Then choose the relationship that connects the known quantities. Substitute values with units where appropriate. Calculate carefully. Finally ask what the answer means in the scientific context and whether its size or direction is plausible.
This final meaning check catches errors that pure arithmetic may miss. A negative value may be impossible for the quantity as defined in the question, or an answer may be orders of magnitude larger than the data suggest. Students should not accept a calculator display as automatically scientific.
Proportional reasoning
Many Science relationships depend on proportional thinking. Students should practise saying relationships in words before using equations: if one quantity doubles while another condition remains fixed, what should happen to the related quantity under the stated model? The exact relationship must come from the syllabus, not from guessing that every graph is linear.
Rates
Rates connect change to time. Students should distinguish “more” from “faster”. A process can produce a larger total change over a long interval while having a lower rate over part of that interval. Graph gradients, average rates and interval selection should be taught conceptually before they become formula routines.
Units as Science
Units communicate what a number represents. Losing the unit is not merely untidy presentation; it can hide whether the student has combined quantities correctly. Encourage learners to track units during working, especially when converting between scales or calculating rates and densities.
When the student is “bad at Science calculations”
Diagnose the first failure. Does the student misunderstand the scientific relationship? Choose the wrong formula? Rearrange algebra incorrectly? Misread the data? Enter the calculator incorrectly? Forget unit conversion? Interpret the answer incorrectly? Each produces the same final symptom — a wrong number — but needs a different tutorial.
Do not reteach the entire Science topic when the weak link is algebra, and do not assign generic Mathematics drills when the student cannot decide which scientific relationship applies. The fastest route is to isolate the interface between the two subjects.
Skill 3: practical work — evidence has to come from somewhere
Practical Science is not a decorative laboratory experience. It teaches students how scientific claims are connected to methods and evidence. Even when an assessment question is written rather than performed, practical reasoning helps the learner evaluate variables, measurements, data quality and conclusions.
Start with the question
Every investigation should have a clear scientific question. If students cannot state what the investigation is trying to find out, they are likely to memorise variable labels without understanding why those variables matter.
Identify the changed and measured quantities
Ask what the student deliberately changes and what outcome is observed or measured. Then ask which other conditions could affect that outcome and therefore need to be controlled for the comparison to be interpretable. Avoid turning “independent variable”, “dependent variable” and “controlled variable” into vocabulary detached from the experimental purpose.
Measurement quality
A method should use an instrument and procedure appropriate to the quantity. Students should consider scale, resolution, consistent reading technique and timing. The depth of treatment varies by G1, G2 or G3 syllabus, but the core habit is stable: ask how the evidence was produced and what could make the measurement more dependable.
Repeat, average and anomaly — with reasons
Students often memorise “repeat and take an average” as a universal improvement. Repetition can be useful when random variation matters, but a repeated flawed method remains flawed. If the instrument is unsuitable or two variables change at once, repeating the same procedure does not solve the central problem. The improvement must match the weakness.
Conclusion versus explanation
A conclusion states what the results support. An explanation uses Science to account for the result. These are related but different jobs. Train students to write the evidence-based conclusion first, then add the scientific mechanism when the question asks for it.
The practical-question checklist
- What is the question or aim?
- What is changed?
- What is measured or observed?
- What should be controlled?
- How is the quantity measured?
- What pattern do the results show?
- What conclusion is supported?
- What limitation matters?
- What specific improvement addresses that limitation?
A student who can answer these questions has a practical reasoning framework that can be applied across many topics.
Skill 4: explanations — connect evidence to mechanism
Secondary Science explanations often need more than a correct fact. The student must choose the relevant fact and connect it to the specific condition in the question. A useful framework is EVIDENCE OR CONDITION → MODEL OR PRINCIPLE → MECHANISM → OUTCOME.
Not every answer needs all four parts explicitly. The question controls the scope. But the framework helps diagnose missing reasoning. If the student writes only the principle, ask how it applies here. If the student writes only the outcome, ask what causes it. If the student quotes data but does not interpret it, ask what relationship the evidence supports.
Command words set the job
Students should recognise that state, describe, compare, explain, calculate, predict, suggest, deduce and evaluate can demand different kinds of responses. Exact command-word conventions should be learned from the student’s syllabus and teacher guidance. The general rule is to answer the requested function rather than unloading everything known about the topic.
Mechanism before polish
When an answer is weak, fix the scientific mechanism before polishing sentence style. A beautifully written answer with the wrong causal relationship remains wrong. Once the mechanism is accurate, refine vocabulary and precision.
Precision without unnecessary length
Long answers are not automatically strong. Students should include enough information to make the required relationship visible. Extra facts can consume time and sometimes introduce contradictions. Teach “minimum complete explanation”: all necessary scientific links, no unrelated chapter dump.
A worked explanation tutorial: density
A student says a heavier object is always denser. The formula may be remembered, but the concept is unstable. Begin without arithmetic: compare two objects of the same volume and different mass, then two of the same mass and different volume. Ask the student to explain “mass per unit volume” in words. Only then use calculations.
Next, change the representation. Provide a table, then a graph, then an unfamiliar object pair. The student should decide whether direct comparison, proportional reasoning or calculation is required. The tutorial succeeds when “heavier means denser” is replaced by a relationship that includes both mass and volume.
A worked explanation tutorial: a biological system
Suppose a student can label a biological structure but cannot explain why it is suited to its function. Ask for the function first. Then identify which structural feature supports that function, how the feature changes the relevant process and what outcome follows. Move from label → feature → mechanism → function.
Finally, change one feature hypothetically and ask the student to predict the effect. This tests whether the student has a functional model rather than a memorised label list.
G1, G2 and G3: adapt depth without changing the learning logic
G1, G2 and G3 Science should not be described as three personalities or three fixed types of learner. They are subject levels with different syllabus specifications and assessment demands. The exact content, depth and paper format must come from the current SEAB documents. A tutor should teach the student’s actual course rather than a stereotype about the label.
The four-skill architecture still travels across levels. Every student benefits from understanding models rather than copying them, reading data accurately, connecting practical methods to evidence and constructing explanations that fit the question. What changes is the complexity of the model, the sophistication of the data, the quantitative demand, the practical expectations and the precision required in explanations.
Do not teach downward by removing reasoning
If a course has less depth, simplify content to the syllabus level without removing the reasoning structure. A student can still ask what changed, what evidence shows it, which concept applies and why the outcome follows. Reasoning is not an enrichment reserved for the highest subject level.
Do not teach upward by adding irrelevant difficulty
Likewise, higher depth should come from the actual syllabus, not from piling on university terminology or unnecessarily complicated calculations. Advanced-looking content can distract from the concepts and representations the student is expected to master.
A tutorial diagnostic for any SEC Science level
- Can the student retrieve the prerequisite concept?
- Can the student explain the model or representation?
- Can the student read the data accurately?
- Can the student choose the relevant relationship or equation?
- Can the student reason about the practical method?
- Can the student build a mechanism?
- Can the student communicate at the required scope?
- Can the student transfer the idea to a changed context?
- Can the student do it with less prompting over time?
The first unstable step is usually the best repair target. A student who cannot explain the model does not need twenty harder graph questions yet. A student who understands everything but writes incomplete answers needs communication practice, not full content reteaching.
From PSLE Science to SEC Science without rebuilding everything
Primary Science already gives students useful habits: observation, comparison, fair tests, evidence, explanations and data interpretation. Secondary learning should extend these rather than pretend the student is starting from zero. The transition becomes easier when tutors explicitly show what is being preserved and what is becoming more sophisticated.
For example, a Primary fair-test idea becomes more formal experimental design. A Primary graph comparison becomes more quantitative data analysis. A Primary cause-and-effect explanation becomes a more technical mechanism using subject-specific models. The learner sees continuity instead of a sudden wall.
The weekly SEC Science tutorial architecture
A 90-minute tutorial can be organised around a repeatable cycle rather than a fixed worksheet count. Begin with cumulative retrieval from previous weeks. Diagnose one weak link. Rebuild the model or concept. Apply it to data or a practical scenario. Construct an explanation. End with a changed exit question.
- 10–15 minutes: cumulative retrieval and prerequisite check.
- 15–25 minutes: diagnostic questions that isolate the first weak link.
- 20–25 minutes: explicit modelling, explanation or worked example.
- 20–25 minutes: guided then independent application across representations.
- 10–15 minutes: correction, error coding and unsupported exit task.
The proportions change by topic. A practical lesson may need more method design; a calculation lesson may need more worked examples; a conceptual misconception may need more modelling. The architecture is flexible because the learning job, not the clock, controls the lesson.
The SEC Science error library
Keep an error library by mechanism rather than chapter. Suggested codes include M model, D data, P practical, X explanation, K knowledge, Q quantitative and R question reading. Add a short future cue beside each repeated error.
Examples: “M — treated the particle diagram literally; ask what each dot represents.” “D — compared final values instead of change; check start and end.” “P — suggested repeating when two variables changed; fix the variable control first.” “X — named the principle but skipped mechanism; connect condition to outcome.”
Review the library every few weeks. Remove errors that remain stable under delayed, mixed practice. Promote recurring errors into deliberate warm-up questions. The library should shrink as the student develops better self-correction.
Interleaving Physics, Chemistry and Biology
Once core concepts are learned, mix disciplines during retrieval so the student must decide which model applies. A graph question from Biology, a rate calculation from Chemistry and a circuit representation from Physics may look different, but the learner practises the common skill of selecting the right representation and reasoning tool.
Do not interleave so early that the student has not learned the individual concepts. Mixing is most useful after initial understanding, when the goal is selection and discrimination. A tutor should know whether the student is struggling because the concept is missing or because several concepts compete for attention.
What independent Secondary Science study should look like
An effective home session can be short: retrieve one model, solve one data question, analyse one practical scenario and write one explanation. Check, correct and schedule one delayed return. This produces four complete learning acts rather than an hour of passive reading.
Students should gradually choose their own diagnostic targets. The mature learner can say, “I understand the topic but I keep misreading rate graphs,” or “My chemistry calculation is fine but I cannot explain what the answer means.” That self-diagnosis makes tutorials faster because the student arrives with better information.
Why a three-student tutorial can suit Secondary Science
Small-group tuition has educational value only when the format changes what the teacher can observe. In a three-student Science tutorial, each learner can be required to explain a model, interpret data, critique a method and defend an explanation. Silence becomes visible, and the teacher can compare three different reasoning paths in real time.
One learner might use the correct formula but misread the graph. Another may read the graph correctly but use a weak model. A third may understand both but write an incomplete explanation. A common worksheet would give them the same page; a diagnostic small-group lesson can give them different prompts while preserving shared discussion.
eduKate Sengkang’s three-student format is therefore most useful when the teacher actively tracks individual weak links. Families comparing Secondary Science tuition in Sengkang or Punggol should ask how individual misconceptions are identified and revisited inside the group, not only how many students sit in the room.
Questions parents can ask a Secondary Science tutor
- How do you distinguish a content gap from a model or representation problem?
- How do you teach students to read graphs and tables before explaining them?
- How do practical questions appear in your weekly teaching?
- How do you handle Science calculations when the weak link is Mathematics?
- How do you adapt teaching to the student’s actual G1, G2 or G3 syllabus?
- How do you revisit corrected misconceptions after a delay?
- How much of the lesson requires unsupported student explanation?
- How do you know when the student is ready for harder transfer questions?
These questions reveal the teaching mechanism. “We cover the syllabus” is necessary but not sufficient. Parents also need to know how the class responds when a student does not understand or cannot apply what was covered.
What parents should not overinterpret
One difficult chapter does not prove the student is unsuited to Science. One strong test does not prove every foundation is secure. One calculation error does not mean the student is “bad at Maths”. Look for repeated patterns across several questions and contexts before making a large judgement.
Secondary Science is cumulative and representational. A student can appear weak while learning a new model because the model itself is unfamiliar. Good diagnosis asks whether the difficulty persists after explicit teaching, guided practice and delayed retrieval.
Useful routes on eduKate Sengkang
- Complete Science Index | eduKate Sengkang Science Estate
- Advanced Science Tutorials | From PSLE to Secondary Science G1, G2 and G3
- Advanced Science Tutorials | Physics, Chemistry and Biology for Beginners
- Advanced Science Tutorials | Scientific Reasoning Skills
- Advanced Science Tutorials | Science Problem Solving Strategies
- Master Science Tutorials Quickly | 60-Minute Science Tutorial System
Frequently asked questions
When does the SEC start?
The Singapore Examinations and Assessment Board publishes SEC syllabuses for 2027 under G1, G2 and G3 subject levels. Students in different cohorts should check the current SEAB pages because examination arrangements depend on the year and course. This article focuses on transferable Science learning rather than reproducing a particular paper format.
Is G3 Science just “harder G2 Science”?
It is better to treat each subject level through its own official syllabus rather than reduce the difference to a single adjective. Content depth, assessment and expected reasoning can differ. The common tutorial skills — models, data, practical reasoning and explanations — should be taught at the level required by the student’s course.
What if a student understands theory but struggles with practical questions?
Teach practical reasoning explicitly. Ask the student to identify the question, variables, measurement, controls, evidence, conclusion, limitation and improvement. Then connect each practical choice back to the scientific purpose. Practical questions are not merely theory questions with laboratory equipment drawn around them.
What if graphs are the main problem?
Separate graph reading from scientific explanation. First train axes, scale, units, intervals, comparisons and trends. Only after the graph is described accurately should the student explain the pattern. Use graphs from several topics so the skill transfers.
Should students memorise definitions word for word?
Students need precise scientific meanings and may need syllabus-appropriate terminology, but definition recall should connect to examples, non-examples and applications. A student who can quote a definition yet cannot recognise the concept in a new situation has not finished learning it.
How much Mathematics does Secondary Science need?
The exact mathematical demand varies by syllabus and topic. Students commonly need confidence with quantities, units, ratios, rates, graphs and algebraic manipulation appropriate to their course. Diagnose whether the weak link is the Science relationship, the Mathematics procedure or the connection between them.
Can a student move quickly without rushing?
Yes, if “quickly” means reducing wasted learning cycles. Diagnose the first weak link, teach only what is missing, require an application, correct precisely and return after a delay. Rushing means skipping reasoning; efficient learning means making the reasoning route shorter and clearer.
The SEC Science tutorial receipt
At the end of a strong Secondary Science tutorial, the learner should be able to answer four questions. Model: what representation am I using and what does it mean? Data: what does the evidence actually show? Practical: how was that evidence produced and how trustworthy is the comparison? Explanation: which scientific mechanism connects the condition to the outcome?
Those four questions travel across Physics, Chemistry and Biology and across different subject levels. The technical detail changes, but the learning architecture remains recognisable. Students become faster not because the Science becomes shallow, but because they develop reliable ways to organise complexity.
For parents, that gives a more useful measure than “Did the tutor finish the chapter?” Ask whether the student can now read the model, handle the data, reason about the method and construct an explanation with less support. When those capabilities strengthen, the student is building a Science system that can survive unfamiliar questions rather than depending on familiar worksheets.
Three extended tutorial laboratories
Laboratory 1 — model to data. Give the student a model and ask for a prediction before showing any data. Then reveal a graph or table and ask whether the pattern supports the prediction. If it does not, ask which assumption in the model or setup needs reconsideration. This teaches the student that models generate expectations and evidence tests those expectations.
Laboratory 2 — data to method. Give a surprising data set and ask how it might have been collected. What variable was probably changed? What was measured? Which uncontrolled condition could create the unusual pattern? Students learn to reason backward from evidence to experimental design rather than seeing methods only as instructions to memorise.
Laboratory 3 — explanation under representation change. Present the same concept first as prose, then as a diagram, then as a graph. Require the student to explain the underlying mechanism each time. If the explanation survives the representation change, understanding is more robust. If it collapses when the diagram changes, the original success may have depended on recognition rather than transferable knowledge.
The parent progress dashboard
Parents do not need a complicated spreadsheet to see whether Secondary Science tuition is working. Track four signals every few weeks: prompt level, transfer, error recurrence and delayed retrieval. Prompt level asks how much help the student needs. Transfer asks whether the idea works in a changed context. Error recurrence asks whether the same misconception returns. Delayed retrieval asks whether learning remains available after time has passed.
A student can make progress before a school mark moves sharply. Needing one cue instead of a full explanation is progress. Catching a familiar graph error independently is progress. Explaining a model accurately three days later is progress. These are not substitutes for formal assessment, but they are earlier indicators that the learning process is becoming more independent.
When the dashboard stalls, return to diagnosis. Perhaps the tutorial is moving to hard questions before the model is secure. Perhaps corrections are happening but never being revisited. Perhaps the student is practising chapter by chapter and cannot select concepts when topics are mixed. The dashboard should change teaching, not merely describe it.
Atlas return routes | Secondary Science
- Science Hub — return to the canonical Science owner.
- Secondary Tuition Sengkang — return to the Sec 1–4 stage route and subject-level context.
- Examination Craft — when Science knowledge is present but timing, checking or paper execution fails.
- Parents’ Guide — when the next question is support, workload, frequency or tuition fit.
- Learning Atlas V2.0 — return to learner state and the wider cross-subject route.
