
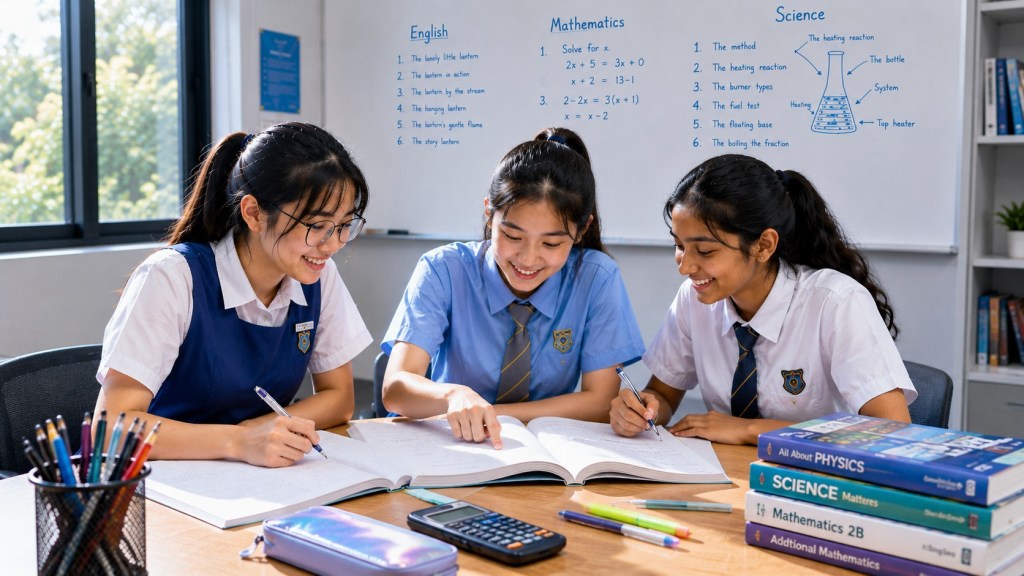
A word problem is not difficult because it contains words. It is difficult when the mathematical relationship is hidden inside the words. The first job is therefore not calculation. It is representation: deciding what each quantity means, what is known, what is unknown, which quantities are connected and which form makes that connection easiest to inspect.
This Secondary 3 Mathematics Learning Guide develops variable definition, diagrams, tables, equations, constraints, assumptions and model checking across algebra, geometry, rates, percentages, graphs and data. It builds on Method Selection Under Mixed Mathematical Load by concentrating specifically on the translation from context to mathematics.
The current 2027 SEC G3 Mathematics syllabus listed by SEAB includes formulation and solution of mathematical problems across Number and Algebra, Geometry and Measurement, and Statistics and Probability. A reliable model should preserve the meaning of the original situation while simplifying it enough to solve.
Representation Is a Choice
The same problem can often be represented in several valid ways: an equation, a pair of simultaneous equations, a table, a graph, a labelled diagram, a ratio, a set diagram or a sequence of unit-rate calculations.
The best representation is the one that exposes the required relationship with the least unnecessary complexity.
Define Variables Before Writing Equations
“Let x be the number” is often too vague. Write what x represents and include units where helpful.
For example: “Let x be the number of adult tickets sold” is stronger than “let x be adults”, because the variable is explicitly a count rather than a person or a price.
Worked Example 1: Translate a Total and a Difference
Two numbers total 58. The larger is 14 more than the smaller. Find the numbers.
Let the smaller number be x. Then the larger is x+14. Total condition:
x+(x+14)=58.
2x=44, so x=22. The larger number is 36. Check: 22+36=58 and 36−22=14.
The phrase “14 more than” is represented by addition to the smaller value, not by multiplying 14 or adding it to the total.
Use a Table When Several Quantities Repeat the Same Relationship
Distance-rate-time, quantity-unit-price-cost and mixture problems often become clearer in a table because the same relationship applies to several rows.
A table is not merely presentation. It can prevent mismatching quantities that belong to different cases.
Worked Example 2: Rate Table
A cyclist travels 36 km at 18 km/h, then 24 km at 12 km/h. Find total travel time and average speed.
First segment time=36/18=2 h. Second segment time=24/12=2 h. Total distance=60 km; total time=4 h.
Average speed=60/4=15 km/h.
A table with columns distance, speed and time prevents the common error of averaging 18 and 12 without considering the journey structure.
Draw a Diagram When Geometry Controls the Relationships
Geometry word problems often become easier after a sketch, even when the sketch is not to scale. Mark right angles, parallel lines, radii, bearings, known lengths and angle labels.
The diagram should record constraints, not imitate appearance.
Worked Example 3: Elevation Model
An observer stands 40 m horizontally from the base of a vertical tower. The angle of elevation to the top is 35°. Find the height, ignoring eye height.
The diagram creates a right triangle with adjacent side 40 and opposite side h. Therefore tan35°=h/40.
h=40tan35°≈28.0 m to 3 significant figures.
The phrase “horizontally from the base” determines the adjacent side. The phrase “vertical tower” creates the right angle.
Separate Data From Conditions
A problem may provide numbers that are not all independent. Some information gives values; other information gives relationships or restrictions.
For example, “the rectangle has perimeter 46 cm” is not a single side length. It is the condition 2L+2W=46.
Worked Example 4: Rectangle Model
A rectangle has perimeter 46 cm. Its length is 5 cm more than its width. Find its dimensions.
Let width=w. Then length=w+5. Perimeter condition:
2(w+5)+2w=46.
4w+10=46, so w=9 and length=14. Check: 2(14)+2(9)=46.
Percentage Models Need an Explicit Base
The phrase “increased by 18%” means multiply the original by 1.18. The original quantity is the percentage base.
When the final amount is given and the original is unknown, the model should be reversed by division rather than subtracting 18% of the final value.
Worked Example 5: Reverse Percentage Model
After a 20% increase, a quantity is 360. Find the original.
Let original=x. Then 1.20x=360, so x=300.
The model states the relationship before calculation. This prevents the incorrect route 360−20% of 360.
Two Unknowns Usually Need Two Independent Conditions
When a problem contains two unknown quantities, a single equation usually leaves infinitely many possible pairs. Look for a second independent condition.
This is the structural reason simultaneous equations appear in mixture, ticket, animal-leg and digit problems.
Worked Example 6: Two Conditions
A shop sells 3 kg and 5 kg bags of rice. It sells 28 bags containing 112 kg in total. Find the number of each type.
Let x be 3 kg bags and y be 5 kg bags.
x+y=28 and 3x+5y=112.
Multiply the first equation by 3: 3x+3y=84. Subtract: 2y=28, so y=14 and x=14.
Check total mass: 42+70=112 kg.
A Graph Can Be the Model
When quantities vary continuously or when comparing two plans, graphing the relationships can reveal intersections, thresholds and rates.
The graph does not replace the equations. It makes the relationship visible in another form.
Worked Example 7: Compare Two Cost Plans
Plan A costs C=20+4n. Plan B costs C=44+2n, where n is the number of sessions.
At equal cost, 20+4n=44+2n. Then 2n=24 and n=12. The common cost is 68.
On a graph, the two lines intersect at (12,68). Before 12 sessions one plan may be cheaper; after 12 the ordering reverses.
Set Diagrams Model Overlap
When categories overlap, a Venn diagram can expose double counting. “Students taking Music or Art” may include students taking both.
The representation should separate only, both and neither regions before totals are combined.
Worked Example 8: Overlap Model
In a group of 40 students, 23 study Music, 18 study Art and 9 study both. How many study at least one?
n(M∪A)=23+18−9=32.
The overlap is subtracted once because it was counted once inside each total.
Constraints Can Reject Algebraically Possible Answers
Algebra can produce candidate values that violate context. Lengths must be positive. Counts may need to be whole numbers. Probabilities lie between 0 and 1. A time cannot be negative in an ordinary travel problem.
Always return to the variable definition after solving.
Worked Example 9: Reject an Invalid Root
The area of a rectangle is 60 cm². Its length is 7 cm more than its width. Find the dimensions.
Let width=x, length=x+7. Then x(x+7)=60, so x²+7x−60=0.
(x+12)(x−5)=0, giving x=−12 or x=5.
Width cannot be −12 cm, so width=5 cm and length=12 cm.
Assumptions Make the Model Work
A mathematical model usually suppresses some real-world complexity. A constant-rate model assumes the rate remains stable. A straight-line cost model assumes the same unit price continues. A geometric model may ignore material thickness or measurement error.
Stating an assumption does not weaken the mathematics. It identifies the boundary within which the conclusion is valid.
Worked Example 10: Constant Rate Assumption
A tap fills 72 L in 6 min. A model predicts 300 L in 25 min.
The observed average rate is 12 L/min, and 12×25=300 L. The prediction is valid under the assumption that the average rate remains 12 L/min for the full 25 minutes.
Model Limits Matter
A linear trend may not continue forever. A constant percentage growth model can become unrealistic over a long horizon. A sample statistic does not describe every individual. A map scale ignores terrain unless represented separately.
The answer should match the model supplied rather than pretending the model is reality itself.
A Reliable Representation Workflow
- Identify what the question asks for.
- Define unknowns precisely.
- Separate numerical data from relationship statements.
- Choose equations, tables, graphs or diagrams that expose the relationship.
- State important restrictions or assumptions.
- Solve within the representation.
- Return the result to the original context and verify it.
Common Errors
Starting calculation before defining the unknown: the arithmetic can become detached from meaning.
Copying numbers without relationships: ask what operation or equation the wording implies.
Using every number just because it appears: some information may be redundant or used only for checking.
Accepting an algebraic candidate without context: check sign, units, integer requirements and physical plausibility.
Independent Practice
1. Two numbers total 74 and differ by 18. Find them.
2. A rectangle has perimeter 54 cm and length 3 cm more than width. Find its dimensions.
3. After a 25% increase, a quantity is 625. Find the original.
4. A runner travels 5 km at 10 km/h and then 3 km at 6 km/h. Find total time and average speed.
5. A tower is 30 m horizontally from an observer. Angle of elevation is 42°. Find height, ignoring eye height.
6. A shop sells 2 kg and 5 kg packs. It sells 20 packs with total mass 58 kg. Find each number.
7. Plan A costs 15+5n and Plan B costs 45+2n. Find the break-even n and cost.
8. In 50 students, 31 study Science Club, 24 Robotics and 12 both. Find number in at least one.
9. A rectangle has area 88 cm² and length 3 cm more than width. Build and solve the equation.
10. A machine produces 150 units in 10 min. State the assumption behind predicting 900 units in 60 min.
Explained Answers
1. x+y=74, x−y=18 gives 46 and 28.
2. 2w+2(w+3)=54 gives w=12, length=15.
3. 1.25x=625 gives x=500.
4. Times are 0.5 h and 0.5 h; total distance 8 km, total time 1 h, average speed 8 km/h.
5. h=30tan42°≈27.0 m.
6. x+y=20, 2x+5y=58 gives y=6, x=14.
7. 15+5n=45+2n gives n=10, cost=65.
8. 31+24−12=43.
9. x(x+3)=88 gives x²+3x−88=0=(x+11)(x−8); width=8, length=11.
10. It assumes the average production rate remains 15 units/min throughout the full hour.
Continue the Secondary 3 Learning Route
Continue with Accuracy, Estimation, Rounding and Calculator Discipline, Error Analysis, Corrections and Transfer Practice, and Mixed-Topic Strategy, Verification and Recovery.
