
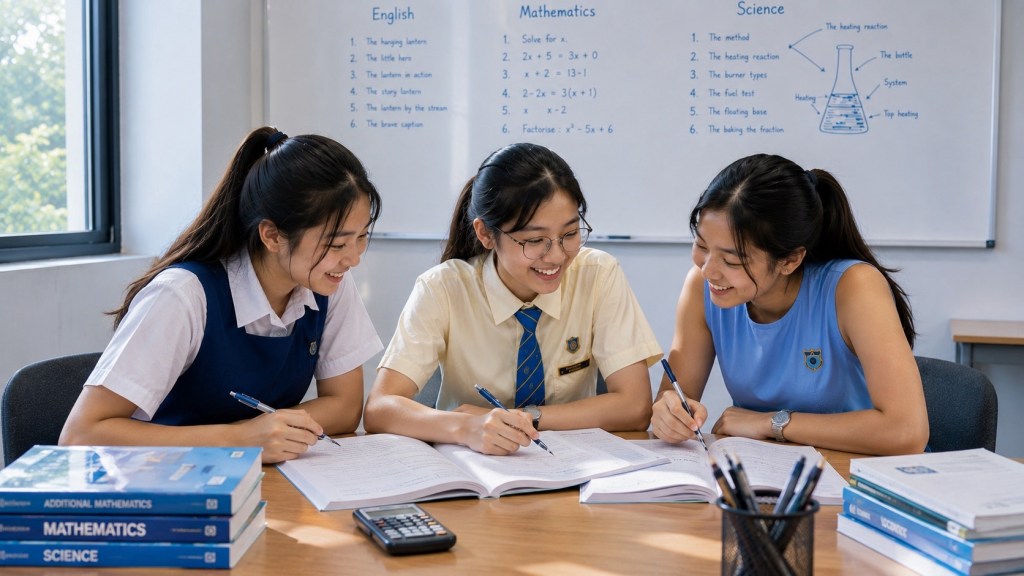
Practical Science is where knowledge meets the physical world. A learner can memorise a definition, draw a graph and recite a method, yet still struggle when asked to decide what to measure, how to control variables, how much to trust a result and how to improve an investigation.
This volume extends Learner’s Guide Vol 0008: Science Concepts, Data and Practical Reasoning and Vol 0012: Science Cause, Mechanism and Evidence in Structured Responses. The focus is practical investigation: variables, measurement, uncertainty, evidence and evaluation.
For 2027 school candidates, combined G3 Science options are K326 Science (Physics, Chemistry), K327 Science (Physics, Biology) and K328 Science (Chemistry, Biology). The official SEAB combined G3 Science syllabus requires Paper 1, Paper 5 and the two structured/free-response papers corresponding to the registered combination. Paper 5 is a 1 hour 30 minute practical test worth 15% of the assessment. Later cohorts should check their own syllabus year.
1. Practical Science begins with a question
Every investigation should answer a question.
What relationship is being tested? What quantity is being changed? What quantity is being measured?
If the learner cannot state the question clearly, the method will usually become a sequence of actions without logic.
Purpose comes before apparatus.
2. Translate the question into variables
Identify the independent variable, dependent variable and important controlled variables.
The independent variable is deliberately changed.
The dependent variable is measured or observed.
Controlled variables are kept sufficiently constant so the comparison remains meaningful.
3. A variable must be operational
Naming a variable is not enough.
The learner should state how it will be changed or measured.
Instead of writing “temperature”, write how temperature is set, monitored and kept at the required value.
Operational detail makes a method reproducible.
4. Not every variable can be perfectly controlled
Real experiments have practical limits.
The question is whether the important alternative explanations are controlled well enough.
A learner should prioritise variables that materially affect the dependent variable.
Control is purposeful, not ritual.
5. Choose a useful range
The independent variable should cover a range wide enough to reveal a relationship.
If values are too close, the effect may be hidden by measurement variation.
If values are too extreme, the system may behave differently or become unsafe.
Range choice is scientific judgement.
6. Choose sensible intervals
Even spacing is often useful for graphs and comparisons, but it is not always compulsory.
The learner should consider where the relationship may change most rapidly.
More points may be useful in a critical region.
Design follows the question.
7. Repeats have a purpose
Repeats help assess consistency and reduce the effect of random variation when an average is meaningful.
They are not a magic phrase.
If a measurement is systematically biased, repeating it reproduces the bias.
The learner should know what problem a repeat is solving.
8. Pilot work is valuable
A short preliminary trial can reveal whether the range, timing, apparatus or measurement method is workable.
It can show that the reaction is too fast, the change too small or the scale inappropriate.
The final method can then be adjusted.
Planning improves through evidence.
9. Measurement has resolution
Every instrument has a scale or digital resolution.
The reading cannot be more precise than the instrument meaningfully supports.
Record measurements consistently.
Do not let the calculator create false precision later.
10. Read analogue scales carefully
Check the unit and scale interval before reading.
View the scale appropriately to reduce parallax where relevant.
Estimate only to a sensible level between scale marks.
A precise-looking number is not automatically a precise measurement.
11. Digital instruments also have limitations
A digital display removes some reading ambiguity but not all experimental uncertainty.
Sensors can have calibration limits, response time and finite resolution.
The learner should not assume digital means exact.
Instrument choice should fit the quantity and range.
12. Timing needs strategy
Short time intervals are vulnerable to human reaction time.
Where appropriate, measure several cycles or a longer interval and divide.
Automated timing may reduce reaction-time effects.
The improvement should match the problem.
13. Measuring length
Align the zero correctly.
Avoid measuring from a damaged edge or an offset origin without accounting for it.
View the scale perpendicular to the reading position when relevant.
Small habits prevent systematic mistakes.
14. Measuring volume
Choose apparatus appropriate to the required precision.
Read liquid levels consistently according to the method taught for the apparatus and liquid.
Avoid interpreting every container as an equally precise measuring device.
Apparatus choice communicates expected precision.
15. Measuring temperature
Allow the sensor or thermometer to reach a stable reading when appropriate.
Keep measurement position consistent.
Consider heat exchange with surroundings.
Temperature experiments often require both measurement control and insulation thinking.
16. Mass measurements
Zero or tare the balance when required.
Keep the procedure consistent when containers are involved.
Avoid transferring material unnecessarily if loss can affect the reading.
Measurement design should protect the quantity being measured.
17. Qualitative observations are data
Colour, state, precipitate, gas, movement or structural changes can be legitimate observations.
Describe what is seen without immediately converting it into an explanation.
Observation and interpretation are different stages.
This distinction supports stronger conclusions.
18. Record data immediately
Do not rely on memory during practical work.
Enter results in the prepared table as they are obtained.
Include units in headings rather than repeatedly inside cells where appropriate.
A good table prevents transcription errors.
19. Design the table before the experiment
A prepared table clarifies what must be measured.
It also reveals missing variables or repeats before time is spent collecting data.
Include space for derived quantities if they will be calculated.
Planning and recording are connected.
20. Keep raw and processed data distinct
Raw data are direct observations or measurements.
Processed data include averages, rates, reciprocals or other calculations.
Do not overwrite raw measurements.
The original evidence should remain visible.
21. Calculate with enough precision
Keep sufficient precision during intermediate calculations.
Round only at the final reporting stage according to the task.
Excessive early rounding can distort a trend.
False extra digits can also misrepresent measurement quality.
22. Graph axes communicate the experiment
Put the independent variable on the horizontal axis and the dependent variable on the vertical axis unless the task specifies otherwise.
Label each axis with quantity and unit.
Choose a scale that uses the graph space effectively.
The graph should make the relationship easy to inspect.
23. Plot accurately
Small plotting errors can change a gradient or conclusion.
Use a sharp pencil where required and read coordinates carefully.
Do not rush the graph because it appears mechanical.
The graph is part of the evidence.
24. Best fit is not dot-to-dot
When a best-fit line or curve is appropriate, represent the overall trend rather than joining every point mechanically.
Scatter is expected in real data.
The line should balance the pattern.
An outlier should not automatically control the fit.
25. An anomaly is not an inconvenience
An anomalous result deserves investigation.
Check for recording mistakes, apparatus problems, procedural deviations or a genuine feature of the system.
Repeat the measurement if practical.
Do not delete a point solely because it spoils the expected pattern.
26. Distinguish random variation
Random variation causes repeated measurements to differ unpredictably around a value.
Repeating and averaging can reduce its influence.
The learner should describe the actual source where possible.
Generic “human error” is too vague.
27. Distinguish systematic bias
A systematic error shifts readings consistently in one direction.
Examples can arise from zero error, calibration or a method that consistently loses material or energy.
Repeating the same method does not remove the bias.
The improvement must alter the cause.
28. Precision and accuracy are different ideas
Precision concerns the closeness of repeated measurements to each other and the resolution of measurement.
Accuracy concerns closeness to the true or accepted value.
A set of measurements can be precise but inaccurate.
This distinction is useful when evaluating results.
29. Reliability is about consistency
A result that can be reproduced under the same conditions is more reliable.
Repeats, larger samples or repeated trials can provide evidence about consistency.
But reliability alone does not prove the method is accurate.
Evaluation should use the right concept.
30. Validity is about the question
An investigation is valid when it meaningfully tests the intended relationship.
Confounding variables can weaken validity.
The method should isolate the intended cause as far as reasonably possible.
A neat graph from a poor design is still weak evidence.
31. Conclusions must match the data
State what the data support.
Do not claim that one variable caused another if the design only shows association.
Do not extend a relationship beyond the measured range without caution.
Scientific restraint is a strength.
32. Use data in conclusions
A stronger conclusion may refer to the observed trend or representative values.
The purpose is to anchor the claim in evidence.
Do not copy every number.
Select the data that matter.
33. Evaluation begins with a specific weakness
Name what went wrong or what limited confidence.
Then explain how it affects the measurement, trend or conclusion.
Only then propose an improvement.
This cause-effect-improvement structure produces meaningful evaluation.
34. Improvements should be feasible
An improvement must be something a student could reasonably do within the experiment.
“Use perfect equipment” is not useful.
Specify the apparatus or procedural change.
The improvement should directly address the stated limitation.
35. Match repeat to random variation
If readings scatter because of small uncontrolled fluctuations, repeats can help.
If the error is a consistent zero offset, repeats do not solve it.
The learner should justify why the proposed improvement works.
Method evaluation is applied reasoning.
36. Match insulation to heat loss
If unwanted heat transfer is affecting the result, insulation or a lid may be relevant depending on the setup.
Explain which transfer is reduced and why that improves the measurement.
Avoid naming insulation without linking it to the limitation.
The mechanism matters.
37. Match automation to reaction time
If manual timing is a major source of variation, a sensor or automated trigger may help.
Alternatively, increasing the measured interval may reduce the relative effect of reaction time.
Choose the improvement that fits available apparatus.
Evaluation is contextual.
38. Match apparatus to scale
If the expected change is small, a more sensitive instrument may be needed.
If the range is large, the instrument must still accommodate it.
Selection balances resolution and range.
There is no universally best instrument.
39. Safety is part of method quality
Identify the actual hazard.
Then state a control that reduces the risk.
Avoid generic statements such as “be careful”.
Good safety advice is specific to the substance, apparatus or procedure.
40. Physics practical thinking
Physics investigations may involve motion, forces, electricity, energy, waves or thermal effects depending on the syllabus.
The method should connect the measured quantity to the physical relationship.
Graphing can help identify proportionality or gradient.
Units and instrument choice are central.
41. Chemistry practical thinking
Chemistry investigations may involve reactions, rates, identification, separation or quantitative relationships.
Observe carefully and distinguish evidence from explanation.
Control quantities such as concentration, volume, mass or temperature when they affect the comparison.
Safety and contamination control can be important.
42. Biology practical thinking
Biology investigations often involve living systems or biological materials whose natural variation may be larger.
Sample size and repeat measurements can therefore matter.
Control environmental conditions when relevant.
The conclusion should respect biological variability.
43. Plan from the graph backward
Imagine the graph you expect to produce.
What should be on each axis? What range and spacing would reveal the relationship?
This can guide the selection of independent-variable values.
Planning backward from evidence improves design.
44. Plan from the conclusion backward
Ask what data would be needed to support the intended conclusion.
Then ask what measurements produce those data.
Then ask what controls make the comparison credible.
This prevents method steps from becoming disconnected.
45. The practical planning template
- state the relationship being tested
- identify independent and dependent variables
- choose range and intervals
- state controlled variables and how they are controlled
- select apparatus and measurement method
- state repeats
- prepare the results table
- describe processing or graphing
- include relevant safety
The template should guide thinking, not become memorised wording.
46. The practical evaluation template
- name the specific limitation
- explain its likely effect
- classify whether it is random, systematic or design-related when useful
- propose a feasible improvement
- explain why the improvement addresses the limitation
This structure keeps evaluation scientific.
47. Practise without apparatus
Practical reasoning can be trained on paper.
Take an experimental diagram and redesign the method.
Create the table, predict the graph, identify likely uncertainties and propose improvements.
This prepares the learner for real practical work.
48. Practise with real apparatus
Paper planning cannot replace handling equipment.
Students need repeated experience measuring, adjusting, observing, recording and responding to unexpected results.
Coordination and judgement improve through use.
The practical paper is a performance.
49. Use post-lab reflection
After an experiment, write three short notes.
- what worked reliably
- what introduced uncertainty
- what I would change next time
This builds a personal practical knowledge base.
50. Build a practical error ledger
- wrong variable identified
- control not operationalised
- range too narrow
- instrument inappropriate
- units missing
- table poorly designed
- graph scale weak
- anomaly ignored
- repeat used for the wrong problem
- improvement not matched to limitation
Each error should lead to a future design or evaluation question.
51. Basic level
At the basic level, identify variables, use common apparatus safely, record measurements with units and follow a provided method.
The learner should distinguish observation from explanation.
52. Developing level
At the developing level, design tables, choose ranges, control variables, plot graphs and recognise obvious limitations.
Repeats and averages are used for a reason.
53. Proficient level
At the proficient level, the learner can plan an investigation, justify apparatus choices, evaluate uncertainty and make conclusions proportional to the evidence.
Unexpected results are investigated rather than hidden.
54. Advanced level
At the advanced level, practical decisions form one connected system.
The learner anticipates uncertainty, chooses measurements strategically, adapts a method during the investigation and evaluates the strength of the final evidence.
Theory and experiment support each other.
55. Paper 5 preparation
The 2027 combined G3 Science Paper 5 is 1 hour 30 minutes and 30 marks, weighted at 15%.
Practise practical work under time only after core handling and reasoning are stable.
The learner needs enough pace to finish while still recording accurately.
Speed without reliable measurement is not useful.
56. Practical examination launch routine
- read the whole task
- identify variables and required outputs
- inspect apparatus
- prepare or understand the table
- note any safety issue
- plan the sequence before irreversible steps
- measure carefully
- record immediately
- check units and graph requirements
A deliberate launch protects the rest of the practical.
57. Recovery during practical work
If a result looks wrong, do not panic.
Check apparatus, units, connections, zero settings, reading technique and procedure.
Repeat when appropriate.
Record honestly and continue with the best available evidence.
58. Checking the practical paper
Check every table heading and unit.
Check that plotted points match the table.
Check that calculations use the correct values.
Check that conclusions and evaluations refer to the actual experiment.
59. The practical mastery test
Choose an unfamiliar experimental question.
Without apparatus, design the method, table and expected graph.
Identify two realistic sources of uncertainty and matched improvements.
Then explain what evidence would support the conclusion.
60. Continue the Learner’s Guide
Use Vol 0013: Secondary 2 Consolidation and Interleaving for cumulative learning, Vol 0014: English Writing for English, and Vol 0015: Mathematics Geometry, Trigonometry and Proof for Mathematics.
For Science foundations, return to Vol 0008 and Vol 0012. The PSLE-to-secondary bridge remains available in From PSLE to Secondary Science G1, G2 and G3.
Official references
G3 Learner’s Guide navigation: ← Vol 0015 · Master Hub · Vols 0001–0069 · Vol 0017 → · Science route.
