
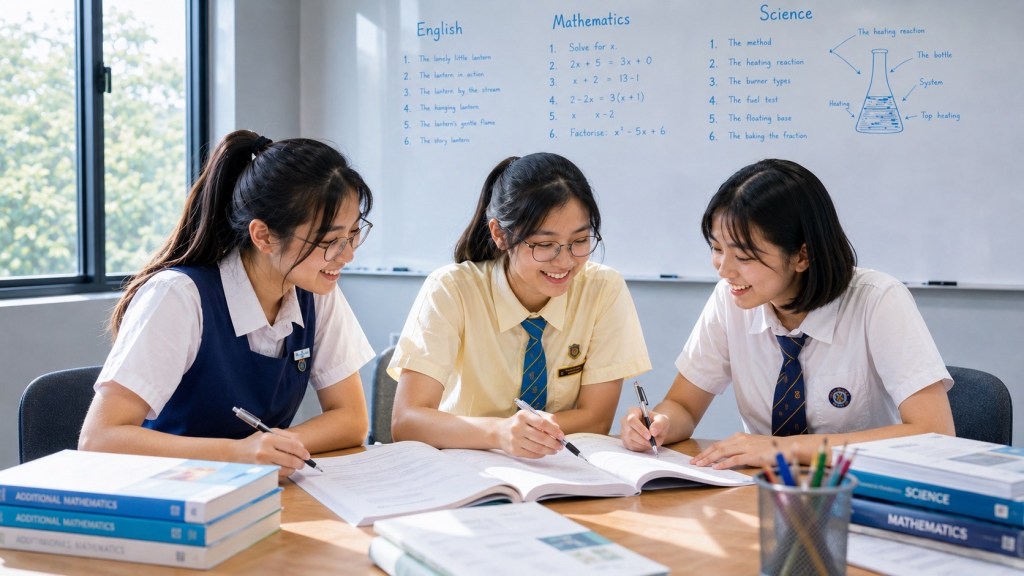
How to perform in the new G2 SEC Science examination on experimental questions is to think like a measurement system. For 2027, the G2 Science combinations are K223 Science (Physics, Chemistry), K224 Science (Physics, Biology) and K225 Science (Chemistry, Biology). The current shared G2 Science syllabus explicitly includes Experimental Skills and Investigations: selecting techniques and apparatus, taking readings, recording observations, interpreting and evaluating data, evaluating methods and suggesting improvements.
This twentieth Learner’s Guide focuses on examination performance rather than laboratory-report writing. The question may show unfamiliar apparatus, a table, a graph or a flawed method. The learner’s job is to identify what is being changed, what is being measured, what makes the comparison fair, how the measurement could fail and which improvement actually addresses that failure.
Use the current SEAB 2027 G2 syllabus page and the learner’s K223, K224 or K225 syllabus for official details. The current syllabus states that experimental-skills questions can assess selection of techniques and apparatus, diagrams, scale reading, tables, graphs, gradients, conclusions from data, modifications to experimental steps, possible sources of error and safety procedures.
Experimental Questions Are Cause-and-Measurement Questions
An investigation is built around a causal comparison. Something is changed, something is measured and other relevant conditions are controlled well enough that the result can be interpreted.
When a method looks complicated, reduce it to three questions: what changes, what is measured, what else must stay sufficiently constant?
The Variable Triangle
- Independent variable: the factor deliberately changed.
- Dependent variable: the outcome measured.
- Controlled variables: relevant conditions kept sufficiently constant so differences in the outcome can be interpreted fairly.
Memorising the definitions is not enough. The learner should be able to explain why a controlled variable matters. If temperature also changes in an experiment intended to compare concentration, for example, the learner must consider whether temperature could alter the measured outcome.
Start With the Aim
If an aim is given, translate it into variables. If the aim is missing, reconstruct it from the method and table headings. The aim should identify the relationship being investigated rather than merely name the apparatus.
A useful form is: “to investigate how X affects Y”. This makes the causal structure visible.
Apparatus Selection: Match the Instrument to the Quantity
Do not choose apparatus because it is familiar. Choose it because it measures the required quantity with a suitable range and resolution.
- time → suitable timing device;
- temperature → thermometer or temperature sensor appropriate to the range;
- mass → balance;
- liquid volume → measuring device suited to the precision required;
- gas volume → suitable gas-collection apparatus.
In experimental Chemistry, the current G2 syllabus specifically includes apparatus used for measuring time, temperature, mass and volume and expects candidates to suggest suitable apparatus in simple experiments. The same general principle applies across G2 Science: instrument choice should match the measurement job.
Range and Resolution
An instrument can be unsuitable even if it measures the correct type of quantity. If the expected volume exceeds the instrument’s range, the setup fails. If the changes are very small relative to the scale divisions, the instrument may not have enough resolution to distinguish them clearly.
A strong apparatus answer therefore considers both what is being measured and how well the instrument can resolve the expected differences.
Read Scales Systematically
When a diagram shows a scale, first identify the value of one small division. Then read the pointer, meniscus or level according to the instrument convention. Do not estimate before you understand the scale.
During checking, ask whether the stated precision is compatible with the instrument shown.
Tables: Headings Carry Meaning
A data table should make variables and units visible. A heading such as “time / s” or “temperature / °C” is more informative than a bare number. If repeated measurements are taken, the structure should make the repeats and any calculated mean clear.
The learner should not hide units inside the body of every data cell if the accepted table convention places the unit in the heading.
Graphs: The Experimental Story in One Picture
A graph connects the independent and dependent variables. Before plotting, identify which variable belongs on each axis, choose a sensible scale, label units and use the data range effectively.
After plotting, the graph can be used to describe trends, identify anomalies, estimate values, determine gradients or intersections and support a scientific conclusion.
Do Not Force a Perfect Line
Experimental data can vary. A line or curve of best fit represents the broad relationship; it does not need to pass through every point. If one point is clearly inconsistent with the overall pattern, treat it as a possible anomaly rather than bending the entire graph to include it.
Anomaly Does Not Mean Delete
An anomalous result deserves investigation. It may arise from random variation, a reading error, a procedural mistake or a real feature of the system. The correct response depends on the evidence.
A strong answer may suggest repeating the measurement at that condition to determine whether the anomaly is reproducible.
Reliability: Would Repeating the Method Give a Similar Pattern?
Reliability concerns the consistency of results. Repeated measurements can reveal variation and make a mean more informative when averaging is appropriate. If repeats are very different, the learner should question the stability of the method or system.
Repeating a measurement is useful when random variation matters. It does not automatically correct a method that is systematically biased.
Random Error and Systematic Error
Random error causes readings to vary unpredictably around a central value. Repetition can help reveal and reduce its influence on an average. Systematic error pushes measurements in a consistent direction, such as a scale that is incorrectly zeroed or a method that always loses some of the substance being measured.
A good improvement must match the error type. “Repeat more times” is weak when the entire method is biased in the same direction every time.
Accuracy, Precision and Resolution Are Different
- Accuracy: how close a measurement is to an accepted or true value when such a reference is meaningful.
- Precision: how close repeated measurements are to one another.
- Resolution: the smallest change an instrument can distinguish or display.
A set of results can be precise but inaccurate. An instrument can have fine resolution but still be used with a poor method. The terms should not be used as interchangeable compliments for “good data”.
Validity: Does the Method Test the Intended Relationship?
A method may produce reliable numbers and still fail to answer the intended question. Validity concerns whether the design actually tests the relationship it claims to test.
If an uncontrolled factor changes at the same time as the independent variable, the conclusion may become ambiguous. The learner should ask whether another explanation for the result remains possible.
Control Variables Need Reasons
When asked for a controlled variable, name the variable and explain why keeping it constant matters. The reason should connect the variable to the dependent measurement.
For example, if temperature can affect reaction rate, allowing temperature to vary while testing concentration weakens the ability to attribute changes in rate to concentration alone.
Fair Test Is Not a Magic Phrase
“Make it a fair test” is too vague. State what must be controlled and how. Examination answers earn clarity by specifying the action: use the same volume, keep distance constant, use samples of equal mass, maintain the same temperature or another relevant control.
Method Improvements Must Fix a Named Weakness
A strong improvement has four parts: weakness → consequence → modification → benefit.
If the weakness is reaction time when timing a rapid event manually, the improvement should address timing or detection. If the weakness is heat loss, the improvement should reduce heat transfer to the surroundings. If the weakness is coarse scale divisions, the improvement should use an instrument with more suitable resolution.
Avoid Generic Improvement Phrases
- “Use better apparatus.”
- “Be more careful.”
- “Repeat the experiment.”
- “Use a more accurate method.”
These phrases may point in the right direction but do not identify what is wrong or why the proposed change helps. Precision is required.
Repetition: When It Helps
Repeating measurements can help estimate a more representative value and identify anomalous results when the same condition is measured several times. The learner should state what is repeated and how the repeats are used.
If a mean is calculated, consider whether all readings should be included. An obvious procedural error should not be hidden inside an average without thought.
Increase the Range When the Pattern Is Unclear
Sometimes a weak design changes the independent variable across too narrow a range. If all measurements are clustered closely, the trend may be difficult to see. Extending the range can make a relationship clearer if it remains safe and appropriate.
This is different from taking more repeats at the same values. More repeats improve evidence about variation; more levels of the independent variable improve evidence about the shape of the relationship.
Use Smaller Intervals When Detail Matters
If a graph suggests a turning point or optimum but the measurements are far apart, use smaller intervals around that region. The improvement should be targeted to the scientific question rather than applied everywhere.
Measurement Frequency
For a process changing over time, the interval between readings affects what the data can reveal. Very infrequent measurements may miss a rapid change or peak. More frequent readings can improve the resolution of the time pattern, provided the method can support them.
Human Reaction Time
Manual timing and manual observation can introduce delay. In fast processes, consider whether automated or electronic measurement would reduce reaction-time uncertainty, or whether the experiment can be redesigned so the start and end points are easier to identify consistently.
Parallax and Reading Position
A scale viewed from the wrong angle can create a reading error. The improvement is not “read carefully” but to place the eye level with the relevant mark or meniscus where appropriate.
Heat Loss
In thermal experiments, energy exchange with the surroundings can change measured temperature changes. An improvement may involve insulation, a lid or faster measurement depending on the specific method. The answer should identify how the modification reduces unwanted energy transfer.
Gas Loss
In gas-producing reactions, delay in sealing the apparatus or leaks can reduce the measured volume. Improvements should address airtight connections and timing of assembly or measurement.
Biological Variation
Biological material naturally varies. If an investigation uses leaves, organisms or tissue samples, the learner should consider sample size, relevant biological differences and whether repeated trials across several samples are needed.
Variation is not automatically “error”. In Biology it may be part of the system being studied.
Safety Is Part of Method Quality
The current G2 Science syllabus allows questions on safety procedures. A useful safety answer identifies the hazard and the matching precaution. “Wear goggles” is strong only when eye protection is relevant to the material or process.
Do not add every possible safety rule. Select the one that addresses the actual risk.
From Data to Conclusion
A conclusion should answer the aim using the evidence. It should not simply restate one measurement.
A good conclusion identifies the direction or relationship and stays within the range tested. If the data shows that Y increased as X increased across the tested values, do not claim that the same relationship must continue indefinitely beyond the experiment.
The Strength of the Conclusion
Ask how strongly the data supports the claim. Repeated consistent results with controlled variables support a stronger conclusion than one measurement with large variation and an uncontrolled factor.
Advanced scientific reasoning includes the ability to say when evidence is insufficient.
How to Answer ‘Suggest an Improvement’
- Name the specific weakness.
- State the modification.
- Explain how the modification reduces the weakness or improves the evidence.
For example, if temperature is read only at widely spaced time intervals and the question requires the maximum temperature, a useful improvement may be to measure more frequently around the expected peak or use suitable continuous measurement. The value of the answer comes from matching the improvement to the limitation.
How to Answer ‘State a Source of Error’
A source of error should be a mechanism by which the measured result can differ from the quantity the experiment intends to measure. Avoid listing normal procedural steps as errors unless you can explain how they distort the result.
Where possible, identify the direction of the effect. If heat is lost to the surroundings, the measured temperature rise may be smaller than it would be in a better-insulated system.
How to Answer ‘Why Repeat?’
Do not stop at “to make it more accurate”. Repetition can help identify anomalous readings, assess consistency and support calculation of a representative value such as a mean where appropriate.
If the dominant problem is systematic bias, repetition alone will not fix it. That distinction shows deeper understanding.
How to Answer ‘Why Control This Variable?’
Use a causal sentence: “Keep X constant because X can also affect Y; otherwise changes in Y cannot be attributed confidently to the independent variable.” Adapt the variables to the actual experiment.
How to Answer ‘What Can You Conclude?’
State the relationship supported by the data and keep the claim within the tested conditions. Use comparative values when they make the evidence clearer.
Do not convert correlation into causation unless the design supports a causal conclusion.
How to Answer ‘Is the Conclusion Reliable?’
Look for repeats, consistency, sample size, anomalies, measurement quality and control of relevant variables. Reliability is not decided by whether the conclusion sounds scientifically reasonable.
Experimental Diagrams: Draw for Function
When asked to draw or complete apparatus, show the parts needed for the method to work. Connections should be clear, collection routes should make physical sense and labels should identify key components.
A beautiful drawing is not necessary. A functional scientific diagram is.
The Apparatus-Role Method
If unfamiliar apparatus appears, identify its role: contain, measure, heat, collect, separate, transfer, support or detect. Questions beyond familiar apparatus can still test general measurement and data skills rather than specialised knowledge.
The Experimental Question Error Ledger
- independent and dependent variables reversed;
- controlled variable named without a reason;
- apparatus measures the right quantity but has unsuitable range or resolution;
- scale read incorrectly;
- table heading lacks quantity or unit;
- graph axis or scale inappropriate;
- anomaly deleted without justification;
- repeat suggested for a systematic problem;
- improvement generic and not linked to a limitation;
- conclusion broader than the data;
- safety precaution unrelated to the actual hazard.
These errors are highly trainable because each one points to a specific reasoning habit.
The 15-Minute Experimental Drill
- Take one method or experiment question.
- Identify independent, dependent and two important controlled variables.
- Name one measurement weakness.
- Suggest one improvement and explain its benefit.
- State the conclusion the data supports.
- State one thing the data does not establish.
This compact drill develops the full reasoning chain without requiring a laboratory session every time.
The Diagram-and-Scale Drill
Use images of measuring instruments and apparatus. Practise scale division, reading position, units and apparatus roles. Then add one question asking which instrument would be more suitable and why.
The Improvement Pair Drill
Write two possible improvements for the same weakness and compare them. Which one addresses the cause more directly? Which one is practical? Which one changes another variable unintentionally?
Comparing improvements teaches judgement instead of memorised phrases.
The Data-Quality Ladder
Level 1 — read
Read scales, tables and graphs accurately.
Level 2 — describe
State trends and anomalies.
Level 3 — explain
Connect the pattern to scientific mechanisms.
Level 4 — evaluate
Judge the quality of the method and evidence.
Level 5 — redesign
Suggest a targeted improvement and explain why it strengthens the investigation.
A Four-Week Experimental-Question Build
Week 1 — variables and apparatus
Practise aims, variable identification, measurement jobs, units, range and resolution.
Week 2 — tables, graphs and conclusions
Read, plot, describe and interpret experimental data. Train evidence-bounded conclusions.
Week 3 — errors and improvements
Compare random and systematic problems. Require weakness → consequence → modification → benefit.
Week 4 — timed mixed questions
Use experiment questions from the learner’s actual Physics, Chemistry and/or Biology combination. Review whether the weakness is scientific knowledge or experimental reasoning.
Physics Experimental Questions
Physics experiments often make measurement relationships visible. Keep quantities, units and apparatus roles clear. Consider reaction time, alignment, scale resolution, energy loss and whether the measurement interval is suitable for the process.
Chemistry Experimental Questions
Chemistry experiments often require careful apparatus choice, observation, gas or liquid measurement, temperature change, purification or qualitative evidence. Connect observations to the chemical process and consider loss of material, incomplete transfer, contamination and heat exchange where relevant.
Biology Experimental Questions
Biology investigations often contain natural variation and living systems that are difficult to control perfectly. Consider sample size, biological differences, environmental variables, repeated measurements and whether the measured quantity is a good indicator of the biological process.
Use the Earlier G2 Science Guides
Use Vol 0008 for the broader MCQ, structured-response and experimental-reasoning system, Vol 0012 for calculations, graphs and data, and Vol 0016 for unfamiliar-context transfer. This volume concentrates the experimental-design and evaluation layer.
The PSLE Bridge
The earlier PSLE rule Evidence Before Explanation remains central. Experimental questions simply expand the evidence: measurements, repeated readings, graphs, anomalies, apparatus and method quality.
Use Examination Craft for Timed Control
For whole-paper pacing, return decisions and checking, continue through the Examination Craft hub. Experimental reasoning needs enough time to read the method before rushing into generic answers.
Final Rule
Do not answer an experimental question with a memorised laboratory slogan. Identify the actual measurement problem.
Name the variables. Match apparatus to the quantity. Read scales carefully. Distinguish random variation from systematic bias. Improve the weakness that actually exists. Draw conclusions no stronger than the evidence. That is how experimental Science becomes examination performance.
G2 SEC Learner’s Guide: open the Vol 0001–0131 index · continue to Vol 0132–0175.
G2 SEC Learner’s Guide navigation: Master Index · Science lane · Examination Craft
G2 SEC Learner’s Guide navigation: Master Index · Science lane · Examination Craft
