
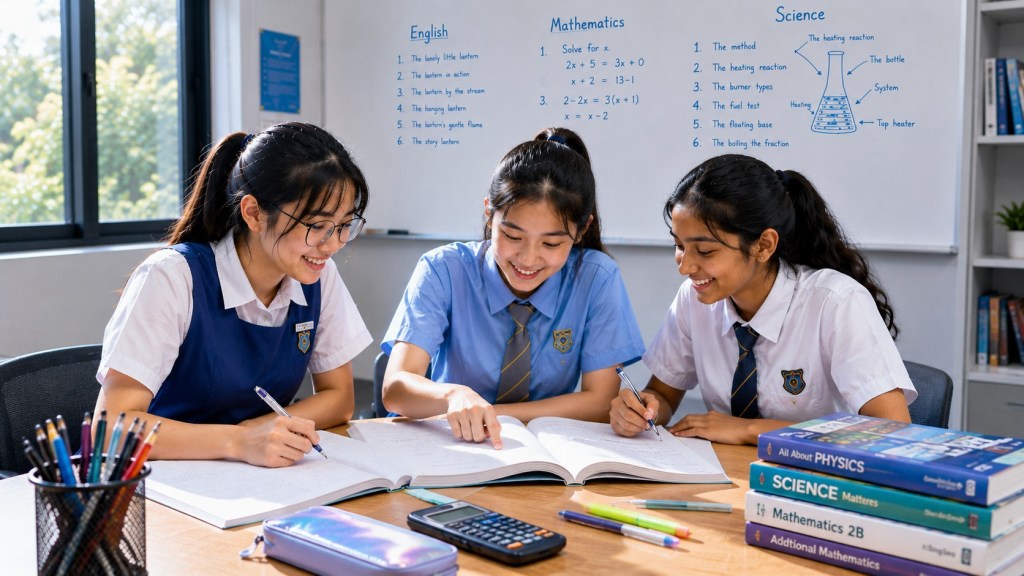
Parents searching for Secondary Science tuition in Sengkang often compare experimental skills, practical Science, variables, fair testing, graphs, data analysis, measurement, evaluation and exam preparation. These skills cut across Biology, Chemistry and Physics because every scientific discipline asks students to reason from evidence rather than memorise facts alone.
A strong Secondary Science tutor in Sengkang should therefore teach students how investigations work: identify the question, choose variables, control competing influences, measure consistently, represent data clearly, interpret patterns, evaluate limitations and write conclusions that match the evidence. The apparatus may change, but the reasoning structure remains recognisable.
At eduKate Sengkang, experimental skills are taught in small groups of up to three students. That lets the tutor inspect how each learner reads an investigation. One student may confuse the independent and dependent variables, another may draw an excellent graph but overstate the conclusion, and a third may identify a limitation without explaining how it affects the result. The same practical question can therefore reveal very different first weak links.
The One-Sentence Goal
A strong experimental-science learner can design or interpret a test, collect and represent evidence, judge the quality of that evidence and explain only what the evidence supports.
Experimental Skills Are a Reasoning System
Students sometimes treat practical Science as a checklist of apparatus and safety steps. Those details matter, but the deeper structure is logical.
- What relationship is being investigated?
- What factor is deliberately changed?
- What outcome is measured?
- What else could influence that outcome?
- How will measurements be made consistently?
- How will results be represented?
- What conclusion is justified?
- What limits confidence?
Once students understand these questions, unfamiliar experiments become less intimidating.
What “Weak in Practical Science” Can Actually Mean
| Visible problem | Possible first weak link | What we investigate |
|---|---|---|
| Variables are confused | Investigation structure | Can the learner distinguish what is changed from what is measured? |
| Control variable is named but not justified | Causal reasoning | Can the student explain how that factor could affect the outcome? |
| Measurements are inconsistent | Method control | Are instruments, timing and procedures used in the same way? |
| Graph is inaccurate | Scale or plotting | Can the learner choose axes, units and intervals correctly? |
| Trend is described vaguely | Data interpretation | Can the student state how one variable changes with another? |
| Conclusion is too strong | Evidence discipline | Does the claim exceed the tested range or data quality? |
| Evaluation lists generic errors | Impact reasoning | Can the learner explain how the limitation affects reliability or validity? |
Independent and Dependent Variables
The independent variable is deliberately changed. The dependent variable is the outcome measured in response.
Suppose a student investigates how the length of a pendulum affects the time for ten oscillations. The length is the independent variable. The measured time is the dependent variable.
Students should be able to describe the relationship in words before touching the apparatus.
Controlled Variables Protect the Interpretation
A control variable is not kept constant merely because “fair tests need controls”. It is controlled because it could otherwise change the dependent variable and create a competing explanation.
In the pendulum example, changing both length and release angle would make it harder to know which factor caused a difference in timing.
Fair Test vs Valid Test
A test can be carefully repeated yet still fail to answer the intended question if the wrong quantity is measured or a major confounding factor is ignored.
We teach students to ask whether the method actually isolates the relationship being investigated.
Measurement: Precision Is Limited by the Instrument
Measurements do not become infinitely precise because the student writes more decimal places. The measuring instrument has a resolution.
A ruler marked in millimetres cannot justify reporting an ordinary length to six decimal places in metres. The reported precision should match the measurement process.
Repeated Measurements and Reliability
Repeating measurements can reduce the influence of random variation and help identify anomalous results.
Students should understand why repetition helps. “Repeat three times” is not a magic phrase. The purpose is to see whether the result is stable and to obtain a more representative value where appropriate.
Accuracy, Precision and Reliability
These ideas are related but not identical.
- Accuracy: closeness to the true or accepted value.
- Precision: fineness or consistency of measurement.
- Reliability: whether repeated measurements or procedures produce reasonably consistent results.
A set of tightly clustered results can be precise but inaccurate if a systematic bias shifts them all in the same direction.
Systematic and Random Error
Random error causes unpredictable variation between measurements. Systematic error shifts measurements consistently in one direction.
Repeating and averaging can help with random variation. It does not automatically remove a systematic calibration error.
Graphing: Representation Is Part of the Method
Students should choose graph types according to the data and relationship.
- Independent variable on the horizontal axis where appropriate.
- Dependent variable on the vertical axis.
- Axes labelled with quantity and unit.
- Scale chosen to use the graphing area effectively.
- Points plotted accurately.
- Best-fit line or curve used where appropriate to the investigation.
A graph is not decoration. It should make the pattern easier to interpret.
Describe Before Explaining
Students often jump straight from graph to theory. We separate two stages.
- Describe the pattern shown by the data.
- Then apply scientific knowledge to explain why that pattern may occur.
This prevents a familiar theory from overriding an unexpected result.
Anomalies: Investigate, Don’t Automatically Delete
An anomalous point is one that does not fit the general pattern. Students should not discard it simply because it is inconvenient.
A better response is to check the method, repeat the measurement if possible and consider whether the anomaly reveals an error or a real feature of the system.
Worked Example: Temperature and Reaction Time
Suppose an investigation measures the time taken for a visible reaction endpoint at several temperatures.
The student should first identify temperature as the independent variable and reaction time as the dependent variable. The amount and concentration of reactants, apparatus and endpoint method should be controlled where relevant.
If reaction time generally decreases as temperature increases, that pattern should be described before the scientific explanation is added.
Conclusion: Match the Claim to the Tested Range
If the experiment tested 20°C to 60°C, the safest conclusion concerns that tested range. It may not be justified to claim that the same relationship continues indefinitely beyond it.
Students learn language such as “within the tested range” when appropriate. This is scientific caution, not weakness.
Evaluation: Name the Effect of the Limitation
Weak evaluation answers often say “human error” or “do more repeats” without connecting the limitation to the result.
A stronger evaluation identifies:
limitation → how it changes the measurement or comparison → why that affects confidence → specific improvement
For example, if a reaction endpoint is judged by eye, different observers may stop timing at slightly different moments. A more objective sensor or clearly defined endpoint could reduce that variation.
Improvements Must Match the Limitation
“Use more accurate equipment” is not always useful. The improvement should address the specific weakness.
- If timing reaction is the issue, use automated timing or a clearer endpoint.
- If temperature changes during the test, improve temperature control.
- If samples vary in size, standardise dimensions or mass.
- If random variation is high, repeat and average appropriately.
Safety: Relevant, Specific, Proportionate
Safety statements should fit the hazard. Goggles are relevant when there is splash risk. Heatproof equipment matters with hot apparatus. Electrical circuits require appropriate voltage and careful handling.
Generic safety phrases are less useful than hazard-specific reasoning.
Experimental Design From Scratch
When students design an investigation, we use a stable sequence:
- State the relationship to be tested.
- Choose the independent variable and range.
- Choose the dependent variable and measurement method.
- Identify relevant controls.
- Plan repeated measurements where useful.
- Decide how data will be recorded and represented.
- Include relevant safety controls.
- State how the conclusion will be drawn.
Why Three Students Can Work Well for Experimental Skills
Practical reasoning benefits from comparison.
- One learner may identify a missing control.
- Another may propose a better measurement method.
- A third may notice that the conclusion overreaches the data.
The tutor can use those differences to sharpen reasoning while keeping every student accountable for their own method and evaluation.
A Practical Lesson Sequence
- Question: identify the relationship.
- Variables: map changed, measured and controlled factors.
- Method: decide how measurement will be consistent.
- Data: organise results.
- Graph: represent the pattern.
- Interpret: describe before explaining.
- Conclude: match claim to evidence.
- Evaluate: identify limitations and targeted improvements.
- Transfer: repeat the same reasoning in a different scientific context.
What Progress Looks Like
- Students identify variables more reliably.
- Controls are justified instead of listed mechanically.
- Measurements are reported with appropriate precision.
- Graphs use cleaner scales and labels.
- Trends are described before explanation.
- Anomalies are investigated rather than automatically removed.
- Conclusions stay within the tested evidence.
- Evaluations explain impact rather than list generic errors.
- Improvements become specific to the limitation.
Frequently Asked Questions
Is practical Science only about laboratory work?
No. Experimental reasoning also appears in written questions where students interpret setups, data, graphs and method quality.
Why does my child write generic evaluation points?
Evaluation becomes stronger when students connect a specific limitation to its likely effect on measurements or conclusions.
How does this help Biology, Chemistry and Physics?
The same investigation logic—variables, measurement, data, evaluation—transfers across the disciplines even though the content and apparatus change.
What should parents bring to a consultation?
A recent Science paper with practical or data questions is ideal. It shows whether the main issue is variable identification, measurement, graphing, explanation or evaluation.
The End Goal Is Evidence-Controlled Scientific Thinking
Experimental skills become powerful when students understand that every method is designed to protect an interpretation. Good Science asks not only “What happened?” but “How do we know, and how confident should we be?”
Continue through the Secondary & Post-Secondary Science route, the Complete Science Index, or the Sengkang tuition enquiry process.
